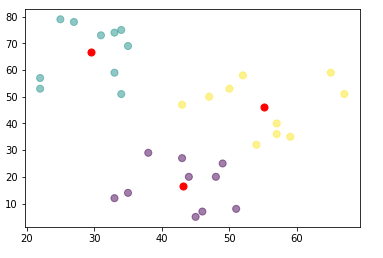
In this tutorial, we will use an example to show you how to implement k-means clustering using scikit-learn Kmeans.

1.Import library
from pandas import DataFrame
import matplotlib.pyplot as plt
from sklearn.cluster import KMeans
2.Prepare data for clustering
Data = {'x': [25,34,22,27,33,33,31,22,35,34,67,54,57,43,50,57,59,52,65,47,49,48,35,33,44,45,38,43,51,46],
        'y': [79,51,53,78,59,74,73,57,69,75,51,32,40,47,53,36,35,58,59,50,25,20,14,12,20,5,29,27,8,7]
       }

df = DataFrame(Data,columns=['x','y'])
3.Implement k-means clustering using KMeans
kmeans = KMeans(n_clusters=3).fit(df)
centroids = kmeans.cluster_centers_
print(centroids)
In this example code, k = 3.
Here centroids is the center of each cluster.
4.Display the clustering result
plt.scatter(df['x'], df['y'], c= kmeans.labels_.astype(float), s=50, alpha=0.5)
plt.scatter(centroids[:, 0], centroids[:, 1], c='red', s=50)
plt.show()
