In this tutorial, we will introduce how to create a plot using plt.scatter() in matplotlib.

1.Download Seattle Weather Dataset
2.Read data using pandas
import matplotlib.pyplot as plt
import pandas as pd
weather_data = pd.read_csv("seattleWeather.csv")
print(weather_data.head())
In this code, we will use pandas to read a csv file.
Run this code, you will see:
         DATE  PRCP  TMAX  TMIN  RAIN
0  1948-01-01  0.47    51    42  True
1  1948-01-02  0.59    45    36  True
2  1948-01-03  0.42    45    35  True
3  1948-01-04  0.31    45    34  True
4  1948-01-05  0.17    45    32  True
3.Create a plot using plt.scatter()
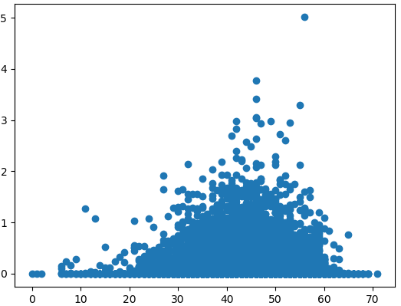
PRCP = weather_data['PRCP']
TMAX = weather_data['TMAX']
TMIN = weather_data['TMIN']
plt.scatter(TMIN, PRCP)
plt.show()
Run this code, you will see this plot.